
HTTP Load Tester
Characteristics
| Attribute | Value |
|---|---|
| Project name | Http Load Tester |
| Prerequisites | JDK >= 1.5 |
| CVS module | HttpLoadTester |
| Responsible developer | Ganesh Jung |
HTTP Load Tester aims
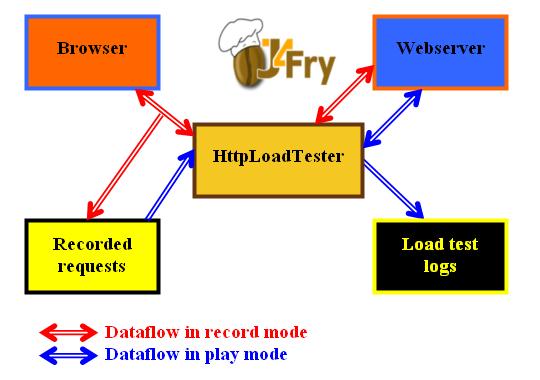
The HttpLoadTester tool has two modes: record and play. In record mode it acts as a proxy between your browser and the machine you want to loadtest and writes the httptraffic to the file system. In play mode it starts multiple threads that replay the recorded HTTP session simultaniously.
HTTP Load Tester usage
HttpLoadTester runs on JDK>=1.5.
Download j4fry-httploadtester-1.2.jar.
View the available options with java -jar j4fry-httploadtester-1.2.jar.
Session recording
Let's assume you access your web application from your client machines browser with the URL https://my.test.host/path/to/your/app. Omitting the port number after my.test.host will make your browser assume port 443 for the https protocol. To record your loadtest session you start the HttpLoadTester on your client machine.
-
Choose a folder - e.g. c:\temp\httploadtester if your client machine is a windows box -
and put
j4fry-httploadtester-1.2.jarhere. -
Open a command shell, cd to your test folder and call HttpLoadTester with
java -jar j4fry-httploadtester-1.2.jar config.properties
Create folders to store record and play logs and set the folders by clicking the "request folder" and "traffic folder" buttons. Select a "macro file name" that is located inside your request folder. Set "server" to my.test.host, "remote port" to 443 and "localport" to 81. - Open your browser with the URL http://localhost:81/path/to/your/app. Your browser should show your application now. Surf all the steps you want to record.
- Click "Stop" to stop recording.
Starting the load test
A load test will usually require a client machine that simulates a bunch of web browsers and a server machine where the web app runs that you want to load test. Let's continue with the example we started with for session recording.
- Choose the client machine for your load tests. For small load tests the windows box we recorded the load test on may be sufficient. Calculate a 2 Ghz Processor per 50 simulated browsers. You may now click "play" and run your load test.
-
If the client machine is a unix box and you recorded on windows edit your
out/files.outfile and replace all the \ through /. Now transfer your completeoutfolder to the client machine. Usually a unix box is a better choice for running the clients on because you can monitor eventual load problems more exactly. Sometimes you will want to run the load tests from 2 or even more client machines at the same time. In this case it is definitely desirable to have unix boxes that you can control through several command shells on the same computer. Simply transfer the same load test recording to each client machine to test folders of your choice. On each client machine you will get separate logfiles and a separate analysis of your load test. -
Supervise the load of all client and server machines - if possible you should
see a window with the
topcommand running for each connected machine. -
To run load tests from a client machine you may start httploadtester on the command line.
Open a command shell on each client machine, cd to your test folder and call HttpLoadTester with
java -jar j4fry-httploadtester-1.2.jar -m play -c 5 -d out -f files.out -e logs -l 5 -t HTTPS -s my.test.host -p 443 -i 300 -o -1
This will start a load tests with 5 parallel clients, each running your recorded session 5 times and simulating 300ms of thinktime in between the requests. Logfiles will be written to thelogsfolder, you find the analysis in a logs/analyse*.j4f file. All the logfiles of one loadtest session will carry the timestamp of the start of the load test in their name. The logs of the single clients will be named logfileyyyy-MM-dd-HH-mm-ss-clientid.j4f, the analysis will be named analyseyyyy-MM-dd-HH-mm-ss.j4f. -
The analyse file will tell you for each request number of times it was
issued (cnt), its maximum, minimum and average runtime in milliseconds
(min, max, avg) and finally its runtime distribution. The runtime distribution
is split in ten equidistant blocks between min and max shows for each block
the number of requests contained in the block and its percentage. Finally 21
stars are distributed among the requests th mirror the percentages graphically.
When reading the analyses check for runtimes over 300ms, because anything slower
will be noticed as "runtime" by the user. You're fine if you have over
90% in this fast block. The rest should be close to the fast block. This is a good distribution:
        >200ms: 70 (70%)      **************
        >270ms: 20 (20%)      ****
        >340ms: 6  (6%)       *
        >410ms: 2  (2%)
        >480ms: 1  (1%)
        >550ms: 0  (0%)
        >620ms: 0  (0%)
        >690ms: 0  (0%)
        >760ms: 0  (0%)
        >830ms: 1  (1%)       *
While this is a bad distribution:>100ms: 80 (80%) **************** >300ms: 5 (5%) * >500ms: 0 (0%) >700ms: 0 (0%) >900ms: 0 (0%) >1100ms: 0 (0%) >1300ms: 0 (0%) >1500ms: 0 (0%) >1700ms: 0 (0%) >1900ms: 15 (15%) ***In the bad distribution you do have 85% in the good block, but there are 15% of the requests that take too long. With such a distribution it's up to you to find the bottleneck within your application that slows down 15% of your requests. Your first step is to open up the file, that contains the corresponding request to see which part of your application has got the bad behavior. Now trace down the application runtime through application logs.
HTTP Load Tester features
HttpLoadTester supports cookies, basic authentication, HTTPS, loops, multithreaded clients, postback params and much more.